
 the lab
practise real markets.
risk nothing.
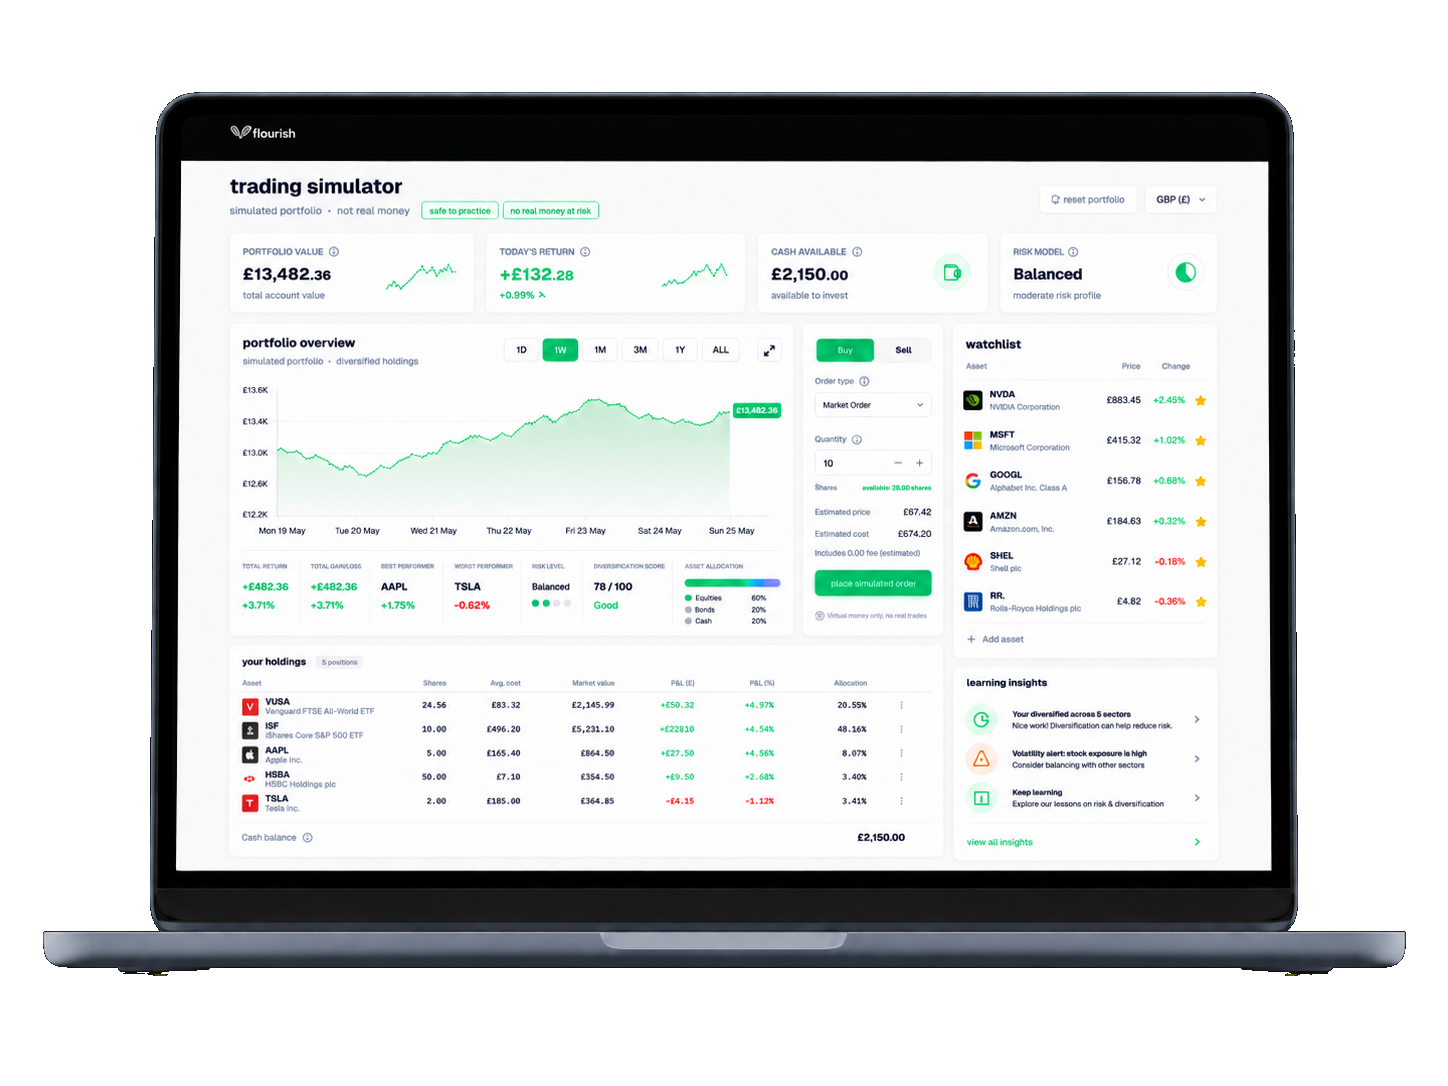
flourish's portfolio lab lets you invest in real tickers, run macro stress tests, and build genuine market intuition — without spending a pound.
 what makes it different
built for learning, not speculation.
most simulators gamify trading. the lab is designed to build real understanding of portfolio dynamics, risk, and macro forces — without the bravado.
real market data15 years of real price history
every ticker in the lab is drawn from real historical price data. lse-listed funds, us indices, gilt benchmarks. no synthetic numbers, no made-up returns. the context is real; the stakes are not.

zero risk, real intuition
practise full investment strategies with a £10,000 simulated portfolio. make mistakes early and understand why they matter.

macro stress tests
replay 2008, 2020, 2022. see how your exact portfolio would have moved through real historical crises, based on your actual allocation.
 how it works
from zero to portfolio in minutes.
build your portfolio
choose from real-world tickers across equities, bonds, and cash. allocate your simulated £10,000 however you like.
watch markets move
real prices update daily. see your portfolio value shift with actual market conditions, not synthetic data.
stress-test scenarios
apply historical crises to your exact portfolio. understand what a real drawdown feels like before one happens.
learn from the ai coach
the ambient audit analyses your positions and surfaces insight about concentration, risk, and portfolio theory.
see your allocation in full.
allocation breakdowns, concentration scores, and volatility by position tell you what your portfolio actually looks like underneath — not just what you intended it to be.
- ✓sector and geographic concentration scores
- ✓historical volatility broken down by position
- ✓correlation signals across your holdings
stress-test before the storm.
apply real historical crises to your portfolio. see how the 2008 collapse or the 2022 inflation shock would have moved your specific allocation. the numbers are historical; the lesson is yours.
- ✓replay 2008, 2020, 2022, and more
- ✓projection based on your actual holdings mix
- ✓historical context included with each scenario
15 years of market data uk-focused tickers (lse + us)historical crisis scenariosno real money, ever
 get started
your first portfolio is
one click away.
free account. real data. no credit card.